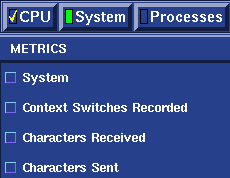
Each category of metrics has its own button. This is the button
![]() for
the CPU metric category. Click on it to display the
CPU metrics available for monitoring.
for
the CPU metric category. Click on it to display the
CPU metrics available for monitoring.
A metric category button looks like this ![]() when it is selected. The LED on the button shows bright green.
when it is selected. The LED on the button shows bright green.
A metric category button looks like this ![]() when it is no longer selected, but metrics
within that category are selected.
when it is no longer selected, but metrics
within that category are selected.
A metric category button looks like this ![]() when both the category and the metrics within that category are selected.
when both the category and the metrics within that category are selected.
When this button
 is on,
the display work area is shown.
When this button
 is on,
the threshold work area is shown.
This button (more...Advanced) ![]() is active only when the
threshold work area is shown.
is active only when the
threshold work area is shown.
Click on this button ![]() to start the
session currently specified. The displays and thresholds you have selected
become active as soon as you click on this button. This button is active only
when no session is running. More information on sessions.
to start the
session currently specified. The displays and thresholds you have selected
become active as soon as you click on this button. This button is active only
when no session is running. More information on sessions.
Click on this button ![]() to stop the current
session. All metric displays close. This button is active only when a
session is running.
to stop the current
session. All metric displays close. This button is active only when a
session is running.